.svg)
Customer Segmentation: Bottom-up and Town Down

I have been fortunate over the years to have worked with many brilliant marketers and product designers. One of my favourite activities during my engagements with them has been deciding which customers would benefit most from the product, and which would be most like to buy and use it. While there are many ways to approach customer segmentation, I realized that it was the quantitative approaches that often intimidated them. It can feel simpler to talk about the attributes of a product or the needs of a customer. Heck, even how a product is manufactured and distributed often dominated conversations about who to sell a new product or service to. As conversations would turn to pricing, forecasting sales volumes, or potential conversion rates of marketing campaigns, it was often an outside expert that would lead this part of the conversation.
Speaking as one of those outside experts, I’d like to share two approaches to customer segmentation that hopefully will make the exercise easier and more effective for business teams.
Thanks for reading David’s Substack! Subscribe for free to receive new posts and support my work.
Subscribed
Approach 1: Top-Down Customer Segmentation
After determining the Total Addressable Market (TAM), a strategy report compiled using industry reports, a SWOT and or PESTLE analysis, and analysis of public transactions, comes the first level of customer segmentation. Determining the Serviceable Addressable Market (SAM).
The SAM is the set of customers that can realistically reached and served by the organization in the face of the competition, applicable laws, the cost to reach them, and overall business strategy. Determining SAM is the first opportunity to perform customer segmentation, in the launch of a new product, or launching in a new market. I have the Jobs-to-be-Done approach to be very effective here. Answer just two questions, how a customer buys or ‘hires’ a product today and why they are doing it.
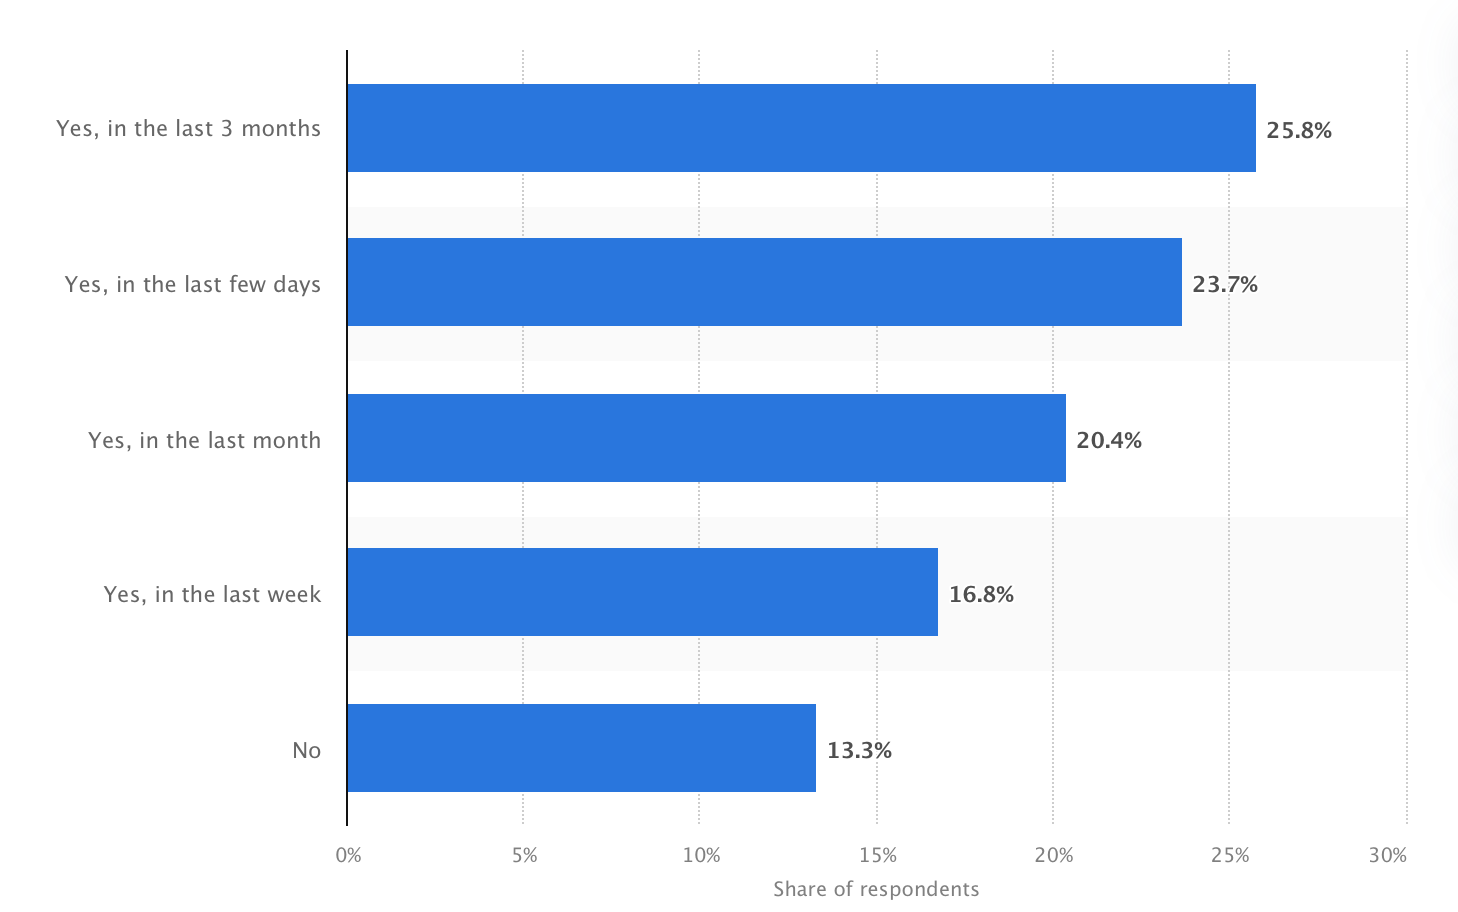
For example, an average of 25% of Thai people (18 million) visited shopping malls in a quarter in 2022. Some came to get groceries for their family, some to meet with friends and share a meal, to buy a gift for their partner, many others do so simply to experience the cool interior.
The TAM of a product to be distributed through all Thai shopping malls would be 18 million. Refining with one additional makes the SAM much clearer.
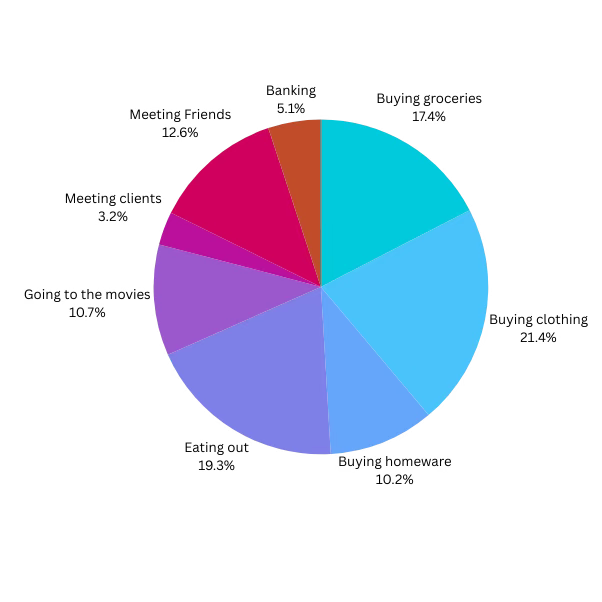
For a company providing homeware (furniture, cleaning supplies, home accessories), the SAM would now be 10.2% of total mall visits per average quarter, or 1.88 million people.
The same approach can be applied for customer visits to a bank branch, enterprise software purchase, and visits to a hospital. The simplicity of this approach is why I use it, but be cautioned some research may be required prior to the main event with business leaders.
Approach 2: Behavioural Patterns and Decision-Making Data
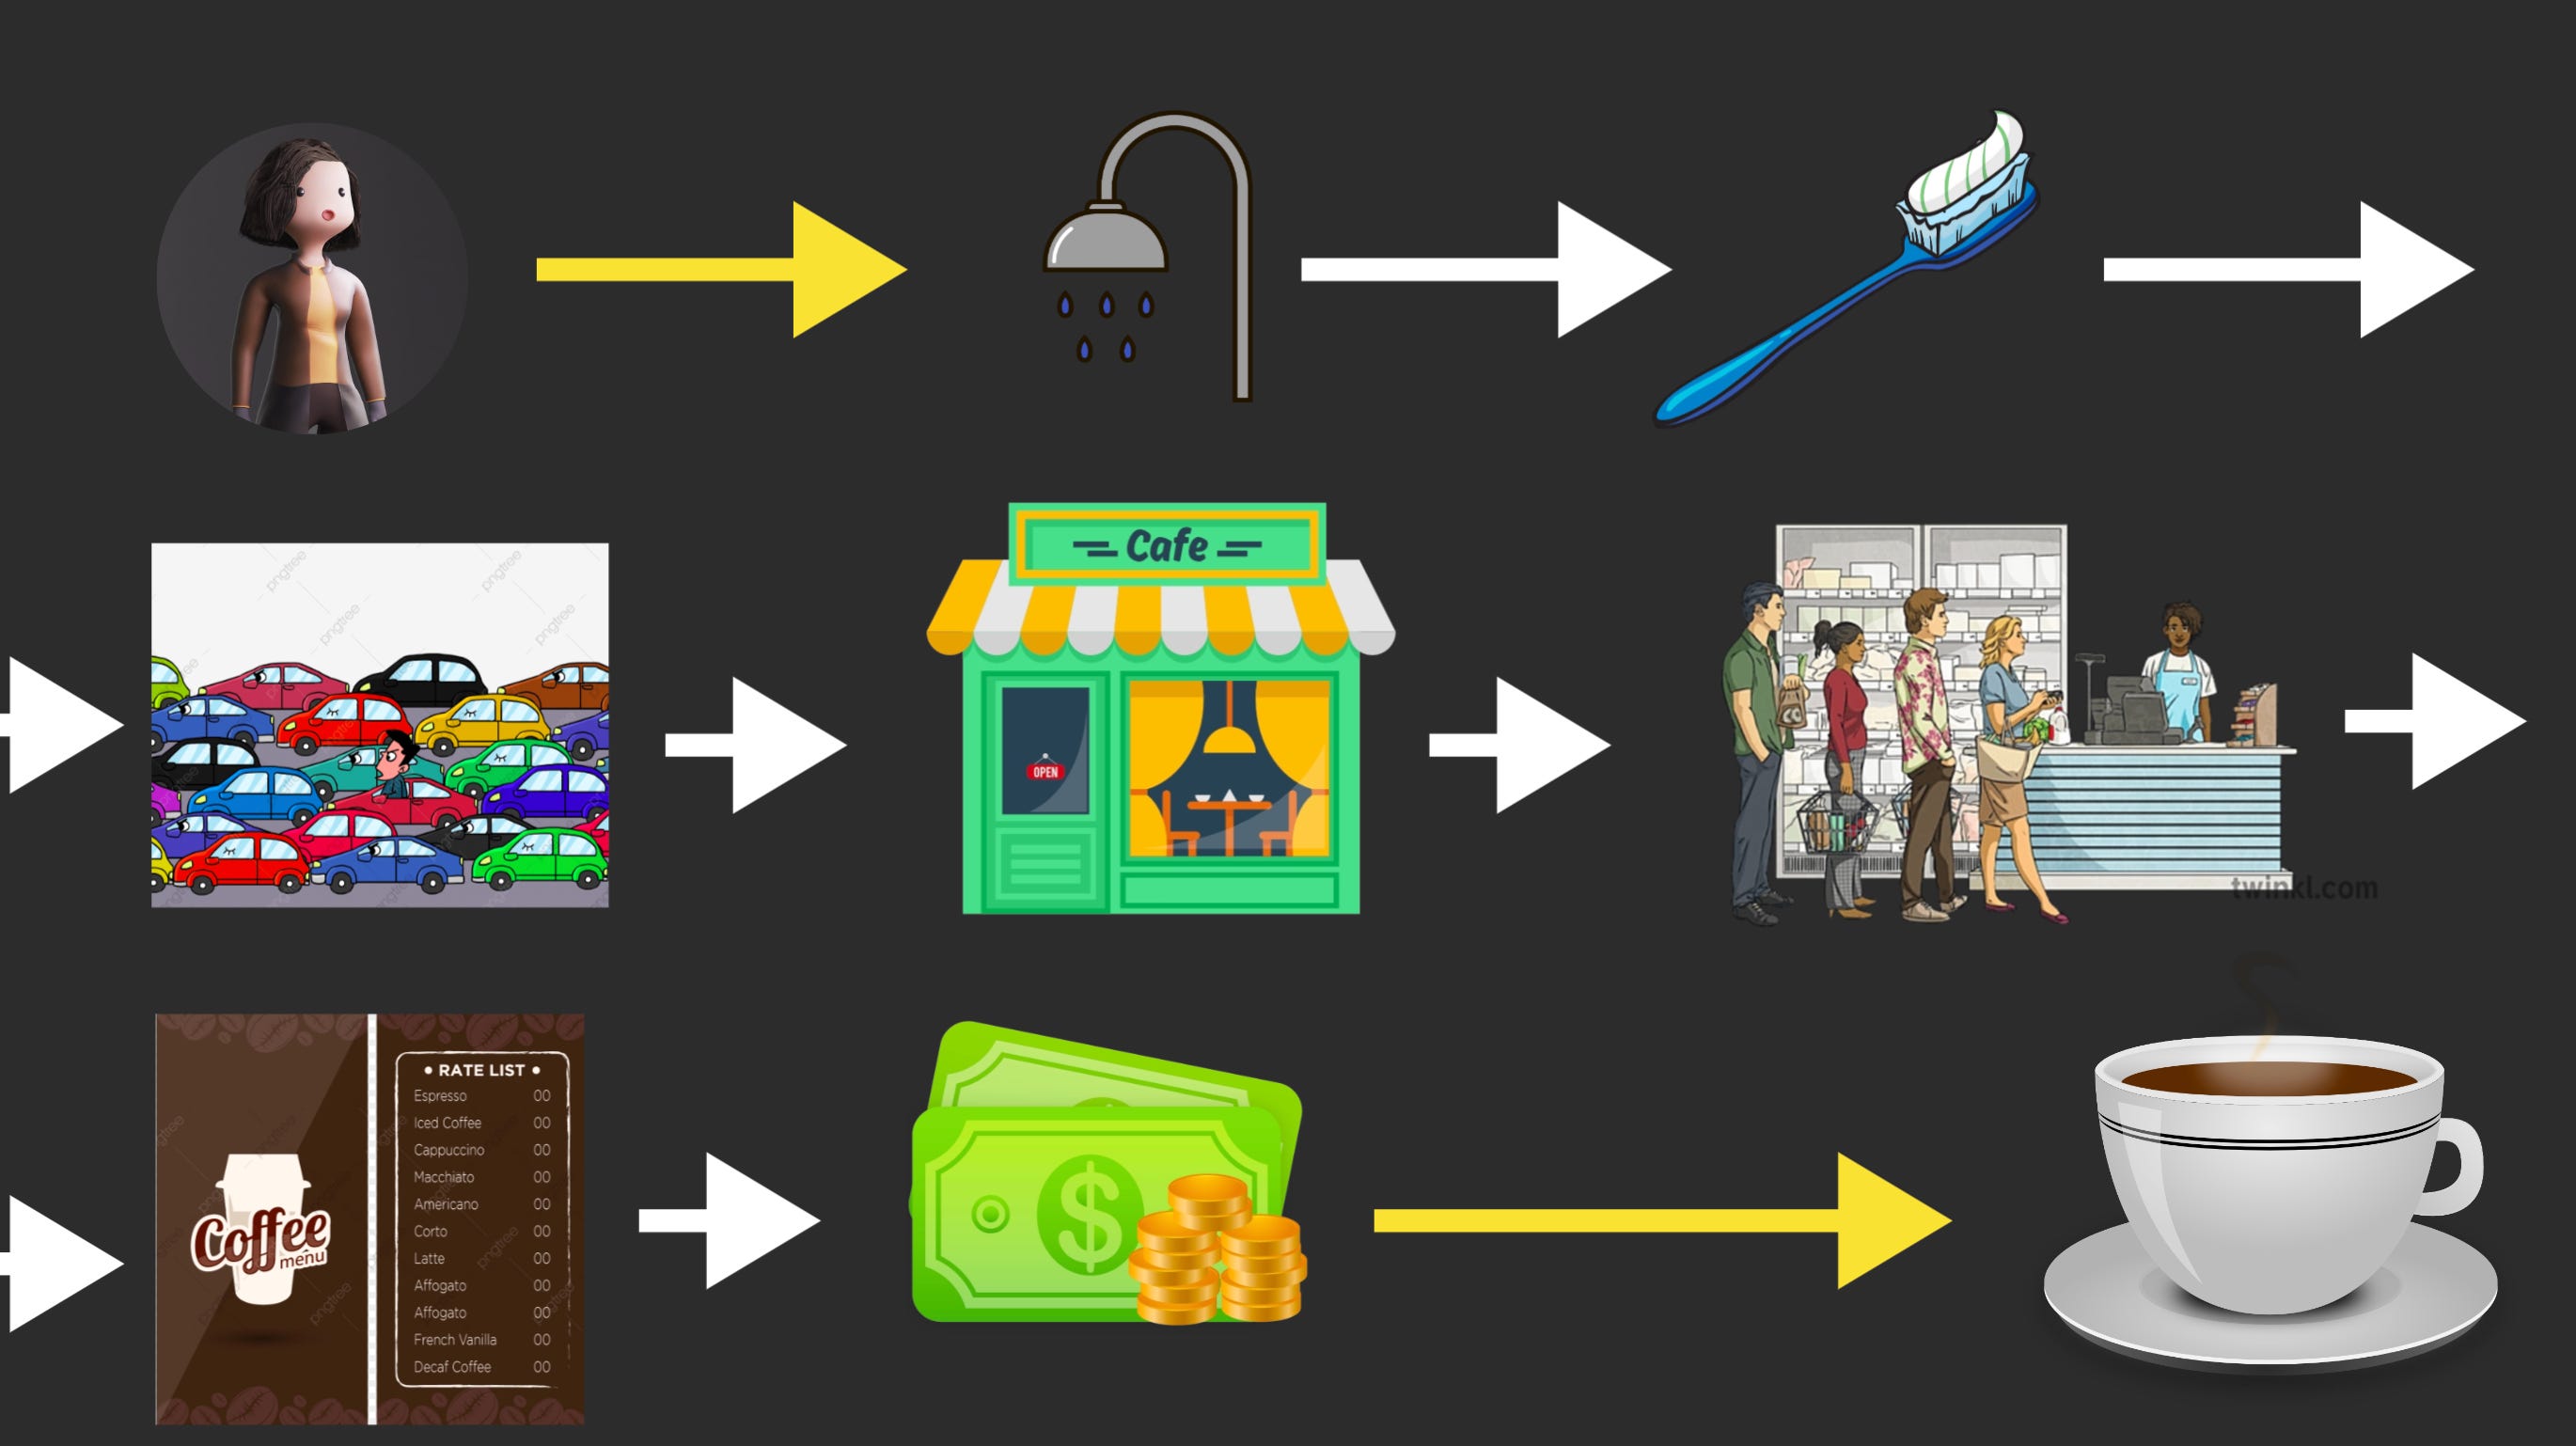
Two information sources are needed for this approach. A customer journey map and operational data. The journey map describes how a potential customer navigates the purchase and product usage journey as-is, without your new product. This map below describes the steps a business traveller takes in the morning to buy and drink their first coffee in the morning.
The second, operational data, is often where outside experts, like me, come in. Many organizations have built highly skilled data science teams, but even in the largest most data-savvy digital organizations (like Amazon in the US or DBS in Singapore) those teams are often under-utilized.
I have worked with highly skilled domain experts; product owners, Cx leaders, and marketers who just didn’t know what data to ask for to help them complete a customer segmentation task. It wasn’t because they lacked empirical skill, it was because the scope and breadth of data available across a purchase and usage journey was often so great, that a report from data science felt too overwhelming. Reports like these are common, and occur typically because the data science colleague lacks the context behind the request.
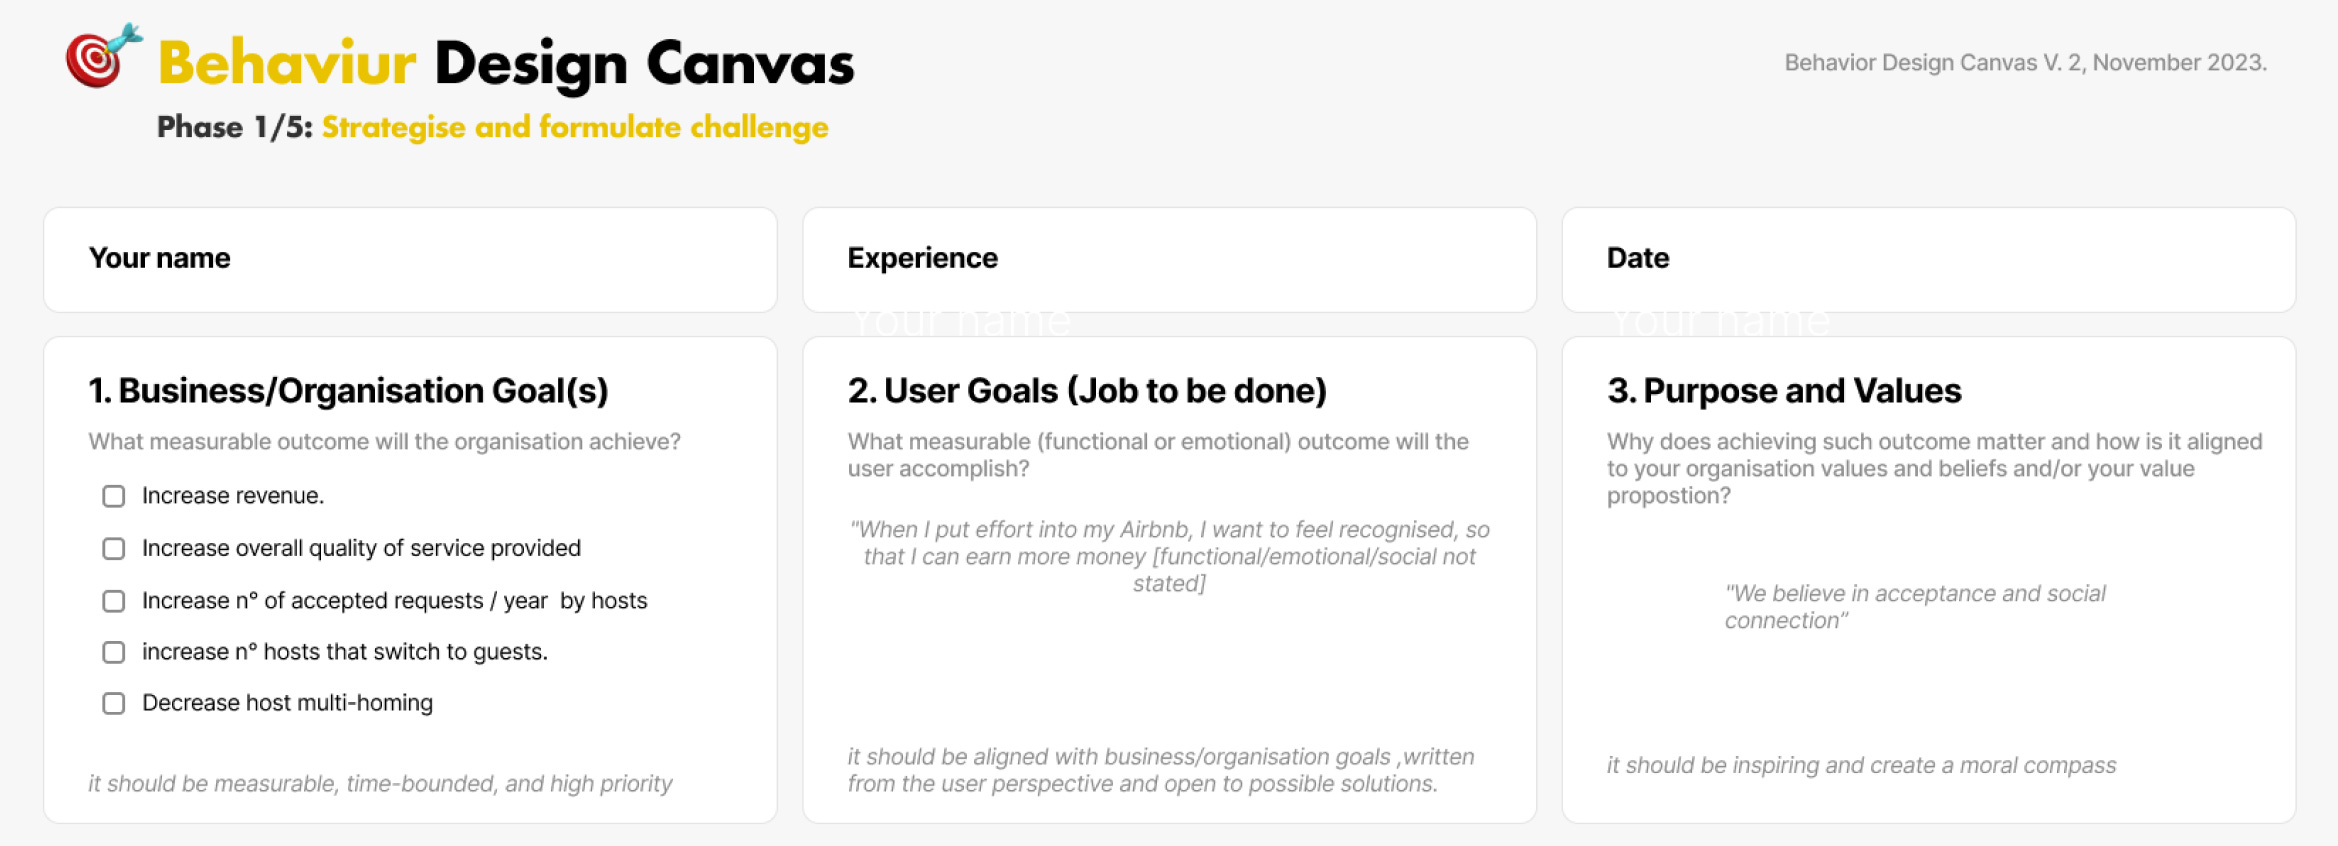
Personally, I like to break this task down into two phases: First, business leadership constrains by providing the desired outcome. This happens in a first meeting where the product vision is set, expected outcomes (typically top-line metrics, revenue gained, expenses reduced).
Second, we apply a behavioural data science lens. We ask for campaign data to understand what prompted the customer to begin their journey (i.e., which campaign creatives), the channels they used, and any other relevant contextual information (i.e., demographics, timing, etc.).
We then ask for operational data, what they bought, where, how they used it, how happy they were with the experience, etc. Sometimes this data alone is sufficient to complete the segmentation, but sometimes data is missing. Typically, it’s contextual and environmental details that are missing. Interviews and ethnographic techniques (journaling, eye-tracking, heat mapping) will help you fill in these missing details.
What is most helpful is to involve the data science team during the segmentation exercises themselves, invite them to the meetings so they can understand the context first-hand, but if it’s not possible, try this. Ask for journey analytics to be sorted by customer task. Did the customer apply for a mortgage to buy an investment property or their first home. Did someone buy homeware as a gift for someone or for an upcoming holiday to decorate their home. Sorting in this way is just one of countless ways to segment a customer base, but this way has the advantage of simplicity, which is why Jobs-to-be-Done has become so popular.
That’s really all there needs to be. Involving the data science team and incorporating operational data offers a way to reduce advertising costs and operational costs by enabling greater precision of campaign messaging and product designs. Involving data science is critical when the goal is to increase experimentation and accelerate innovation. Layering on a behavioural science lens will help both product and marketing teams design far more effectively, but that’s for another post.